

Option Strategy - Dynamic (Rolling) ATM Straddle
Straddle is an Options strategy where the same expiry and same strike (in this case, At the Money) call and put option are either bought or sold.

Under this section, you will be able to combine multiple calls and puts and create any strategy to track and analyse the positions.
We will cover features such as Dynamic or Rolling ATM Straddle, Static Straddle Table/Charts, Multi Strike Price Charts, Multi Strike Open Interest Charts, Strategy Charts.
First, we will cover Dynamic ATM Straddle below.
Dynamic or Rolling ATM Straddle
Straddle is an Options strategy where the same expiry and same strike (in this case, At the Money) call and put option are either bought or sold.
Rolling ATM straddle is to track the ever changing ATM strike prices and plot them on a chart to track the option pricing behaviour.
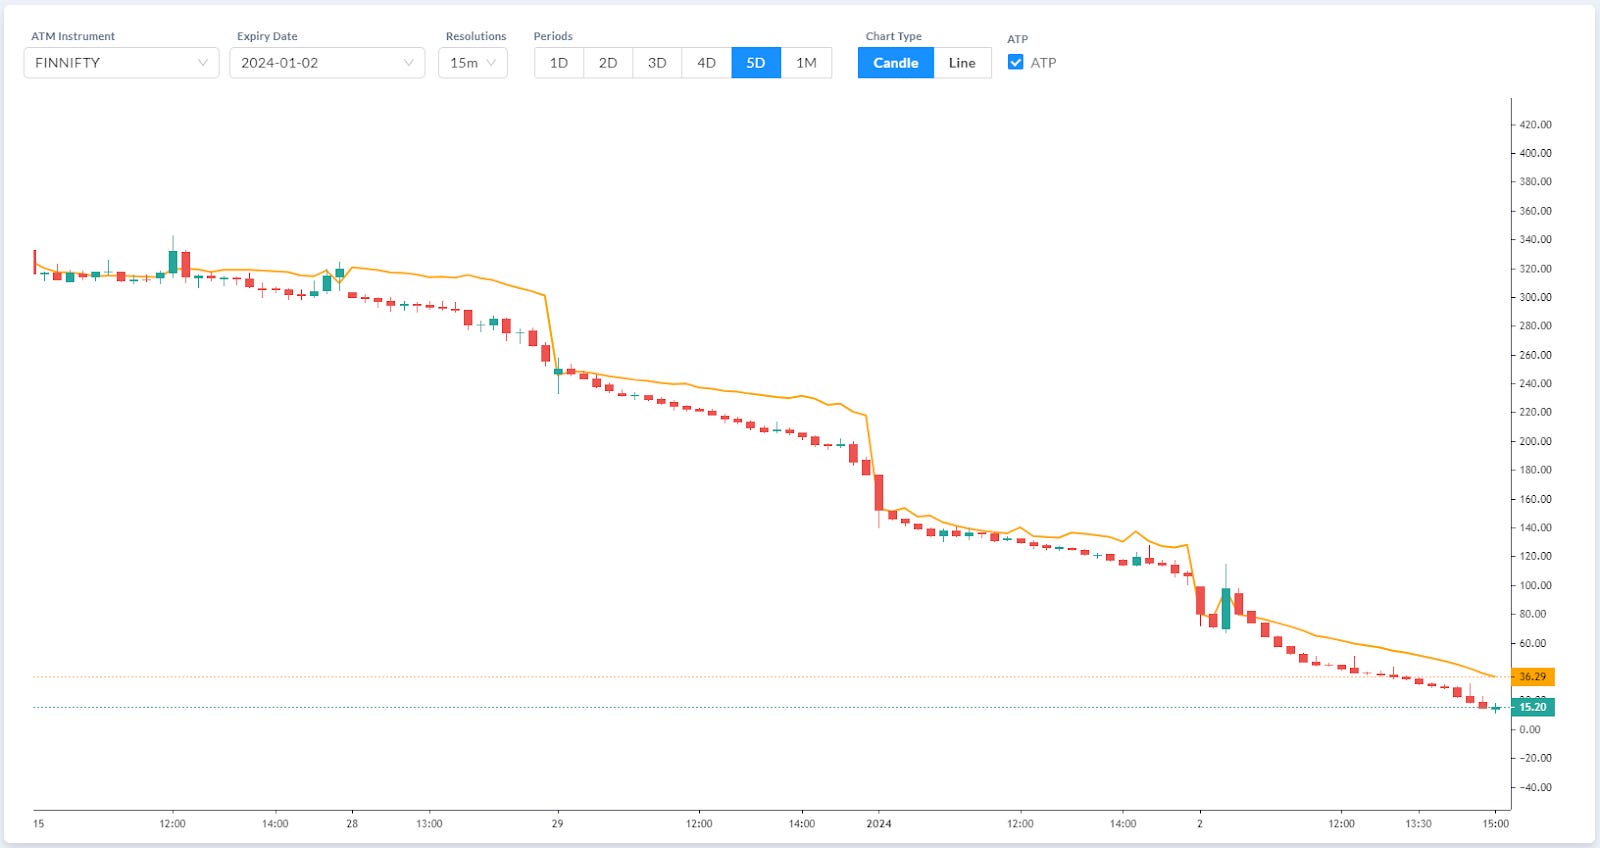
You have an option to select any Indices and you can either use a Candlestick or Line format to plot the prices.
To explain this with an example, if BankNifty Spot Price is at 48880, then At the Money strike will be 48900 strike. Adding the 48900 Call and Put LTP and plot the values, you will get an ATM Straddle price chart.
At time T1 (10.30AM), spot price is at 49225, then ATM strike is 49200,
At time T2 (10.31AM), spot price is at 49290, then ATM strike is 49300,
If we track the ATM strikes continuously and add the Call and Put LTP and plot the prices, voila, you will get the Rolling ATM Straddle Price Chart.
We track this at every price tick and calculate the ATM straddle prices.
Advantages of doing this at every tick, we are able to plot a candlestick chart that captures the true price at every second which is not possible if you consider just a single price (closing price of every minute).
In the next post, we will cover Static Straddle Charts.
where to plot these graphs?