

Index Top 10
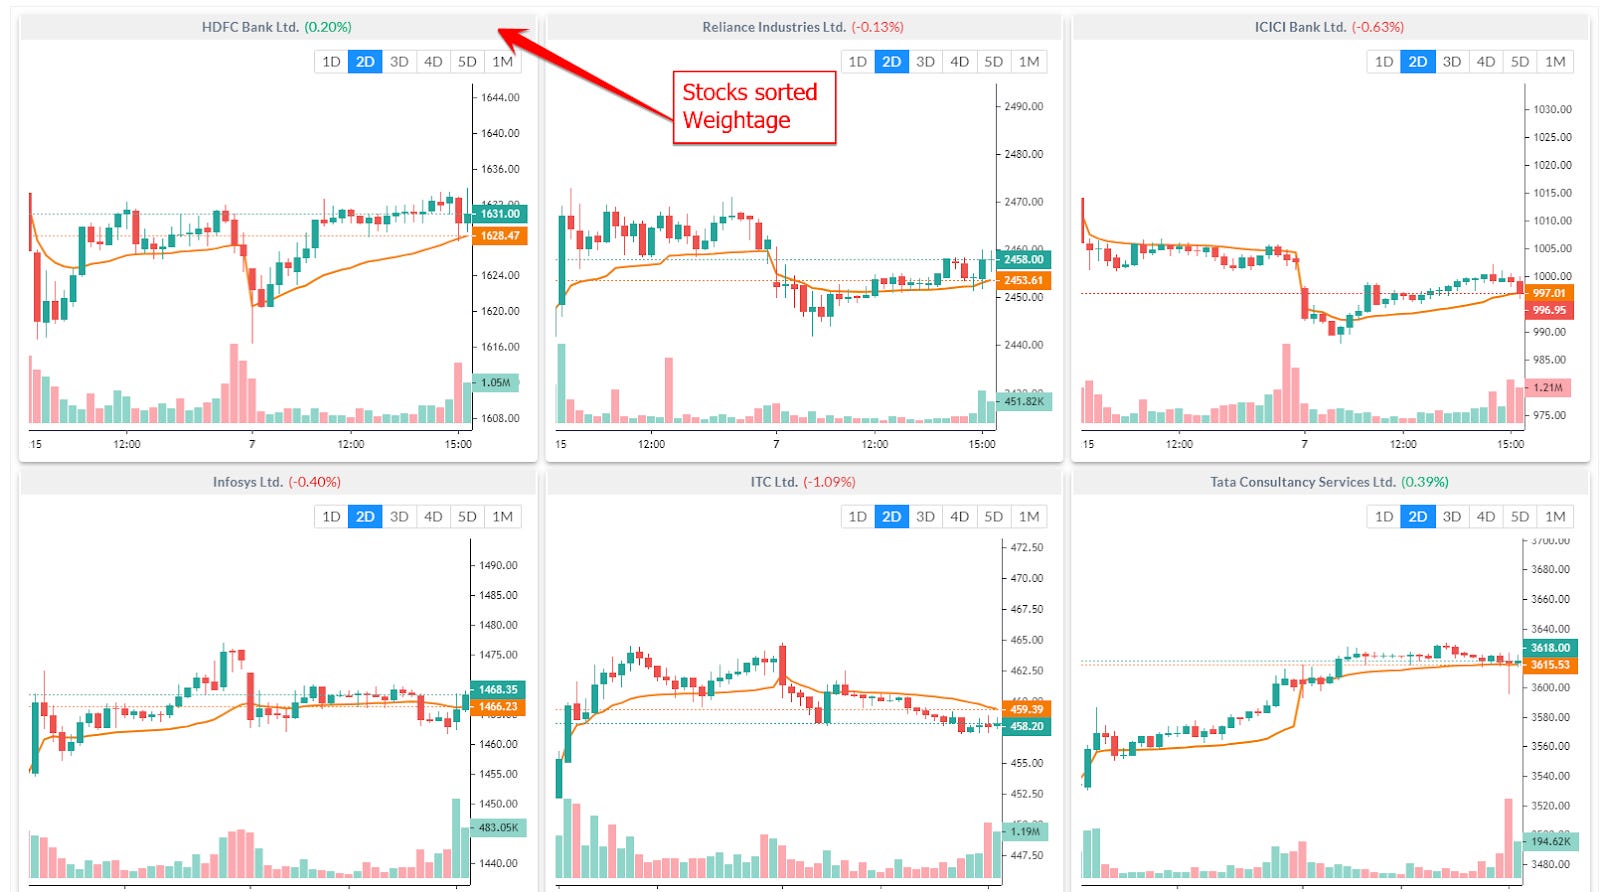
Top 10 underlying stocks sorted by weightage contribute more than 60-80% of index movement, hence by tracking the Top 10 stocks, you will be able to understand the market sentiment whether they are bu

What is an Index?
An Index is a specific collection of stocks chosen based on specific characteristics such as Market Capitalization, Sectors, etc. We have Market Cap based Indices, Nifty 50, Nifty Next 50, Midcap, Smallcap, etc. We also have Sectoral Indices such as Nifty IT, Nifty Pharma, BankNifty, FinNifty, etc. There are many different indices available in NSE and can be viewed here
https://www.niftyindices.com/
In FNOTrader.com, we track the Indices available for Derivatives trading (futures & options) and we also track the NSE Sectoral Indices.
Indices available for Futures & Options trading at the time of writing this are, Nifty, BankNifty, FinNifty, MidcpNifty provided by NSE and Sensex and Bankex provided by BSE.
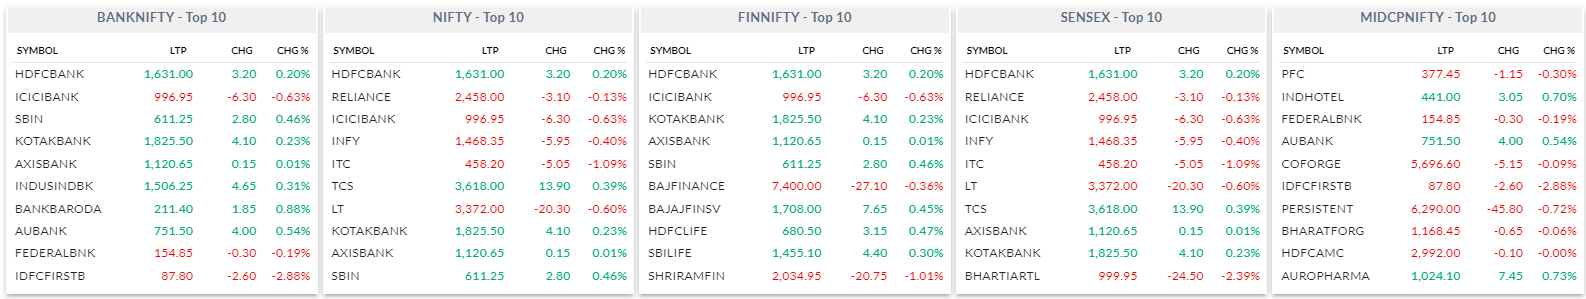
For these Indices, the Top 10 underlying stocks sorted by weightage contribute more than 60-80% of index movement, hence by tracking the Top 10 stocks, you will be able to understand the market sentiment whether they are bullish/bearish or neutral.
Here are the Top 10 stocks for Indices available for Futures and Options.
Above table is available under the “Index Watch” feature.
Top 10 Charts along with Index Chart
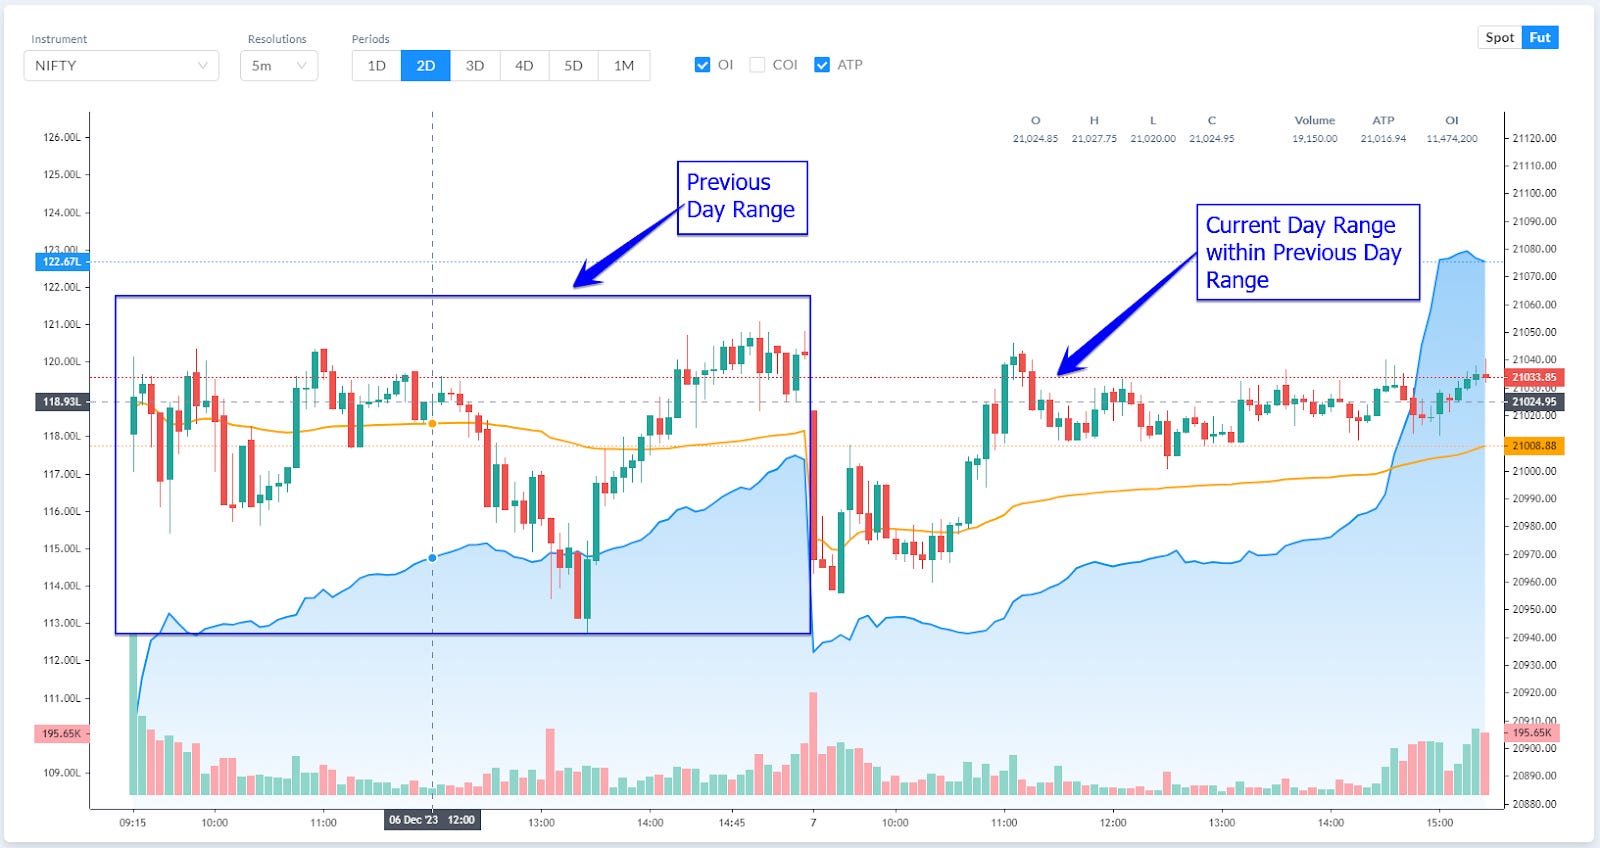
This is the corresponding Index Chart
As you can see from the Top Index Heavy Weights, stocks are in a range bound day and some of them are trading above the ATP line and some of them are trading below the ATP line and there is no consensus among the heavy weights.
As the Top 3 are trading above ATP (VWAP) line, hence, you see that the Index is also trading above the ATP line.
You would expect a Bullish move on an Index, if you see the underlying heavyweight stocks are trading above the ATP line and moving higher and higher and continuously breaking Day High’s and vice versa for the Bearish move.
Based on the type of day that you infer from your analysis, you would be able to employ a suitable strategy for the day.
For example, if you observe the day to be range bound, then you can employ a scalping trade on futures or options, or a non-directional options strategy trade, there are multiple ways to trade the same market understanding.
Just to highlight, the Options Decay behaviour on the same day looked like this. Days like this are perfect for Non-Directional strategy like Selling the Straddles if only we know the day is going to be range bound.
This is a chart of Dynamic or Rolling ATM straddles, (this chart tracks the ATM at every second and plots the chart in real time). We will cover this feature in detail separately.
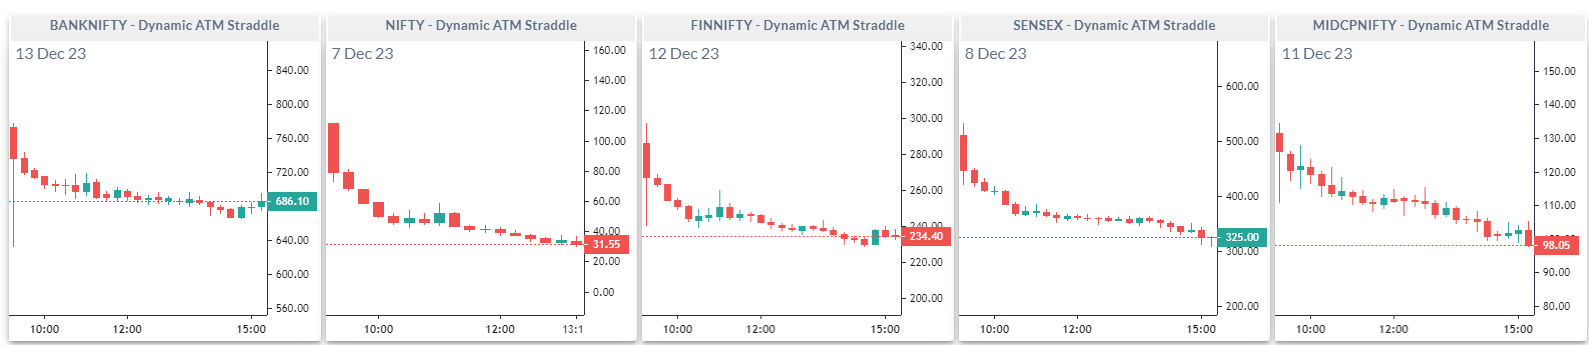
This proves that it’s a sensible approach to consider tracking Top few heavyweights of the Index in your analysis.
Let us know in the comments how you would/are using the Top 10 Index Constituents in your analysis.
In the next post, we will explore the dashboard that provides a sneak peak about the overall market under ‘Futures Dashboard”.