

Gauge Market Direction - Price vs OI Table
Understand Options Markets at Macro level using Price vs OI Table.

Analyse Futures and Options activity parallely for each time interval and determine trend of the underlying.
Note : For this analysis to work on Options, there should be enough liquidity, so it works magic on Indices but not so much on other underlyings where the options liquidity is not much beyond ATM strikes.
Let’s look at what are the options available and how we can make use of this feature to find the direction / trend of the underlying.
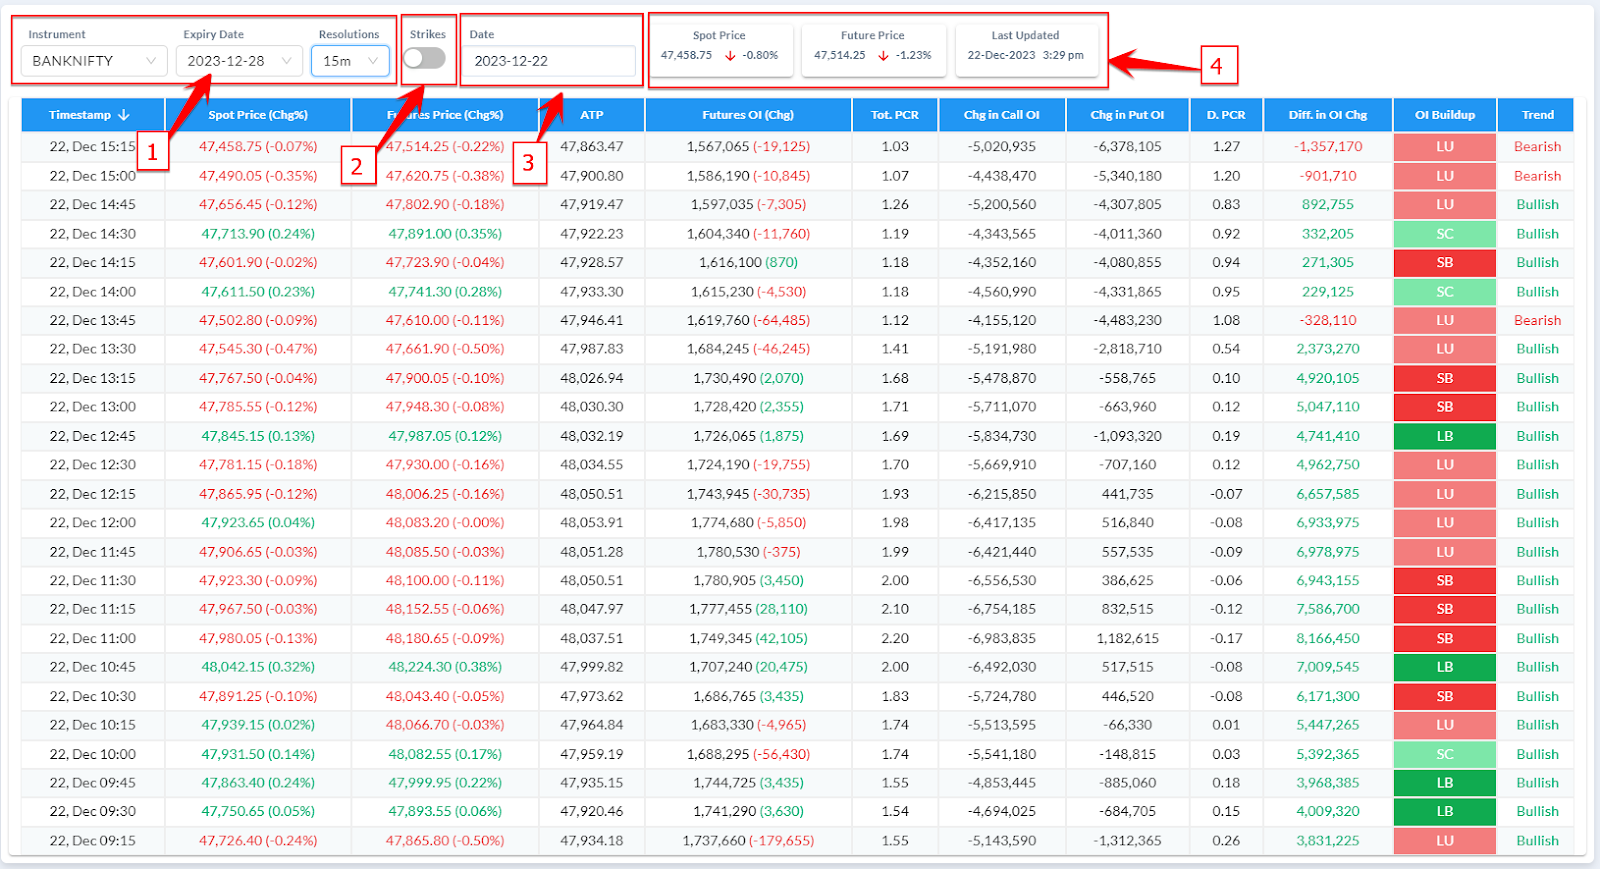
You can select the underlying, expiry and time interval for your analysis. All the indices are covered, and all of the stocks that trade in derivatives.
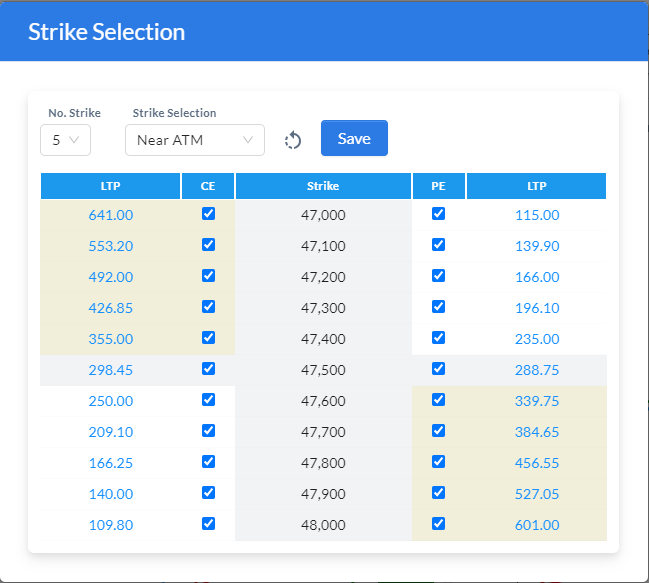
You also have an option to select the number of strikes from ATM for your options analysis. It is defaulted to ATM +/- 5 strikes.
For the active expiries, you can also select any of the previous dates and see how it has worked. We do not have data for expired contracts.
Spot and current month Futures price is displayed, along with the time of update.
For example, in the above screenshot, BankNifty is selected to show the last trading day (Friday 22-Dec). (There is no selective nitpicking of the data to show the working example, just picked the last trading day to show the power of this feature)
This is the Banknifty chart of 22-Dec (Friday)
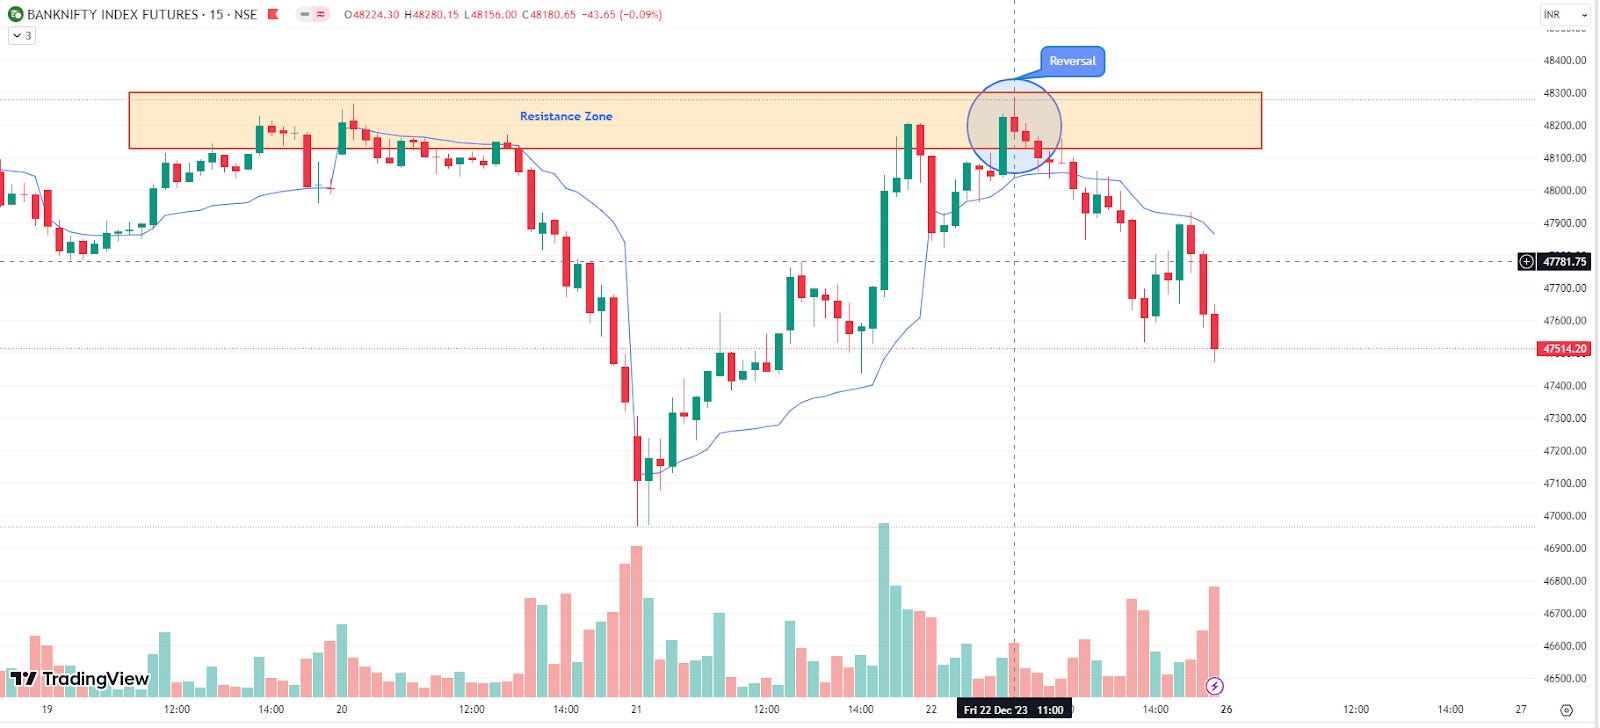
As you can see, the price entering the Resistance Zone around 10:45 - 11:00 AM, seems like it will breakout, so you will want to see how the price behaves in this zone and also, how the option market participants are positioning themselves when the price breaks out or gets rejected.
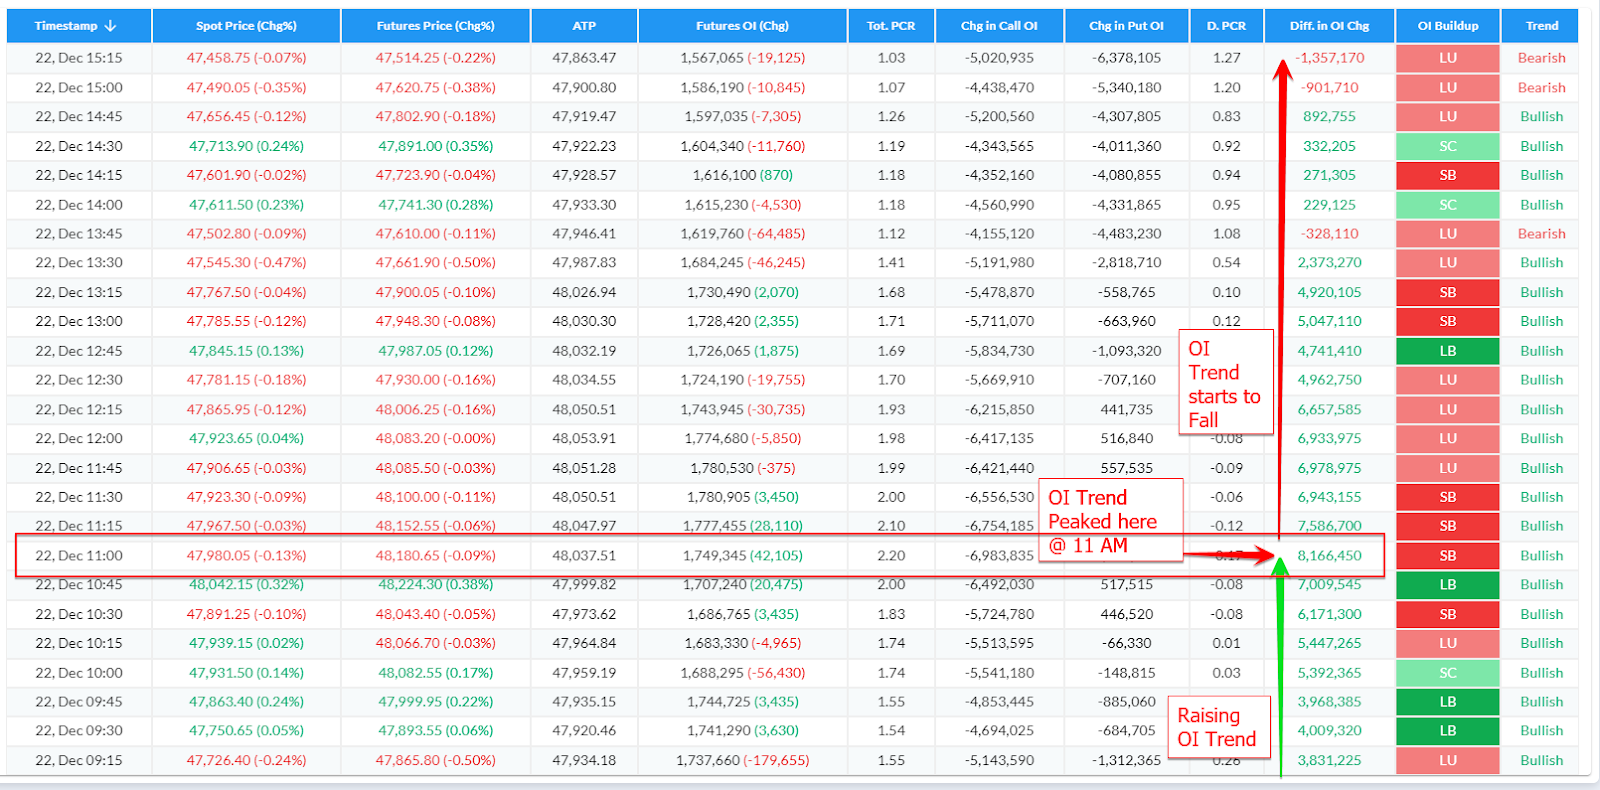
At the Resistance Zone @ 11am, you can see the price is getting rejected and subsequently OI Trend has peaked and starts to fall along with the price, this shows, the Call Sellers are overpowering the put sellers.
While the Trend still is bullish, as the OI Trend is still above 0, but you can see the price starts to reverse and you can find a short trade opportunity here.
You can see, the Spot and Futures price, both were closing in the positive for 3 consecutive closes, you will start to see the price is closing lower.
Just remember, Open Interest is a lagging indicator. NSE publishes every 3 minutes.
Timestamp: Shows the Date and time interval of the analysis
Spot Price and Change: Shows the Underlying spot price and changes for the time interval. For example, if you are doing an analysis at a 15 mins interval, the price change is shown for every 15 mins, and not from Previous close.
Futures Price and Change: Shows the Current Month Futures price and changes for the time interval. For example, if you are doing an analysis at a 15 mins interval, the price change is shown for every 15 mins, and not from Previous close.
ATP (VWAP): Shows the Average Trade Price of the day (closely matches with VWAP). One of the most important data point for an intraday trader.
Futures OI (Change): Shows the Open Interest of the current month Futures and absolute change for every time interval.
Tot PCR (Total PCR): Shows the Put Call Ratio of the selected strikes. It adds up the total of Call side OI and Put side OI and computes the PCR (Tot PCR = Total Put OI / Total Call OI).
D.PCR (Developing PCR): Shows the Put Call Ratio of the selected strikes based on the change in Open Interest. It adds up the total change in Open Interest of Call side and Put Side and computes the D.PCR. (D.PCR = Total Put OI Chg / Total Call OI Chg).
PCR Range = 0.8 to 1 (Neutral), Above 1 (Bullish), Below 0.8 (Bearish).
Chg in Call OI: Shows the Total change in Call OI of the selected strikes. (Call Sellers Position)
Chg in Put OI: Shows the Total change in Put OI of the selected strikes. (Put Sellers Position)
Diff in OI Chg: Shows the difference between Chg in Put OI and Chg in Call OI. (Chg in Put OI - Chg in Call OI). This is also called OI Trend, shows who is winning the tug of war between Call and Put Sellers.
Buildup: Shows the Futures Price and OI relationship and displays either Short Buildup, Long Buildup, Short Covering or Long Unwinding.
Trend: Shows the Open Interest Trend which is calculated from the difference between Put OI change and Call OI change. If it’s above 0, shows bullish, below 0, shows bearish. Also note the values of change.
In the next post, we will see how the same information can be tracked using a line chart, along with Total Open Interest and OI Change.