

Futures: Market Movers
With the Market Movers page, you will be able to track and analyse the stocks that move the markets for the day, also called, “Stocks in Play”.

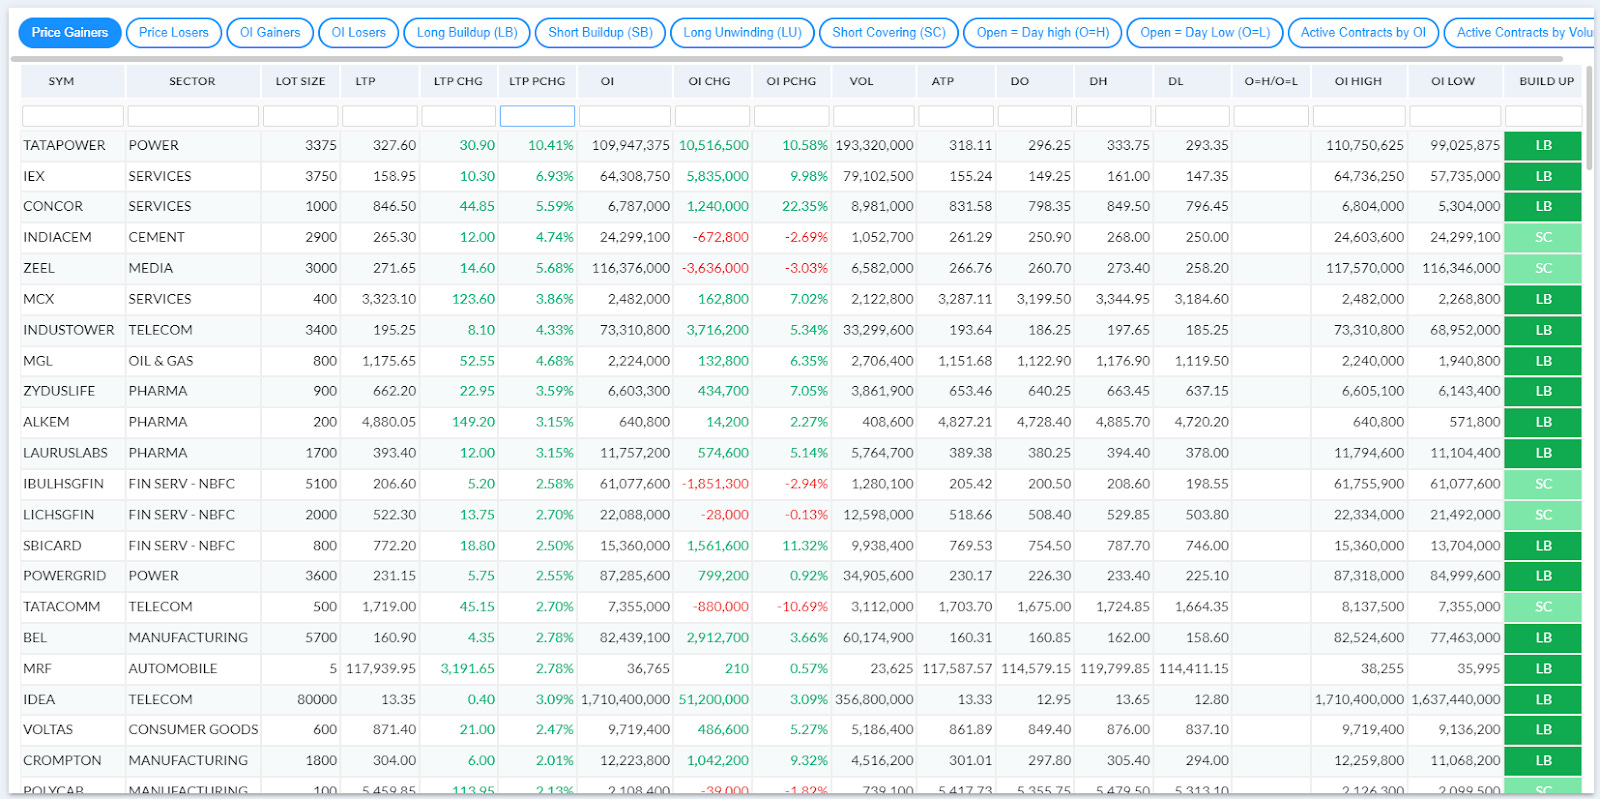
You will be able to see the following information for each of the Futures.
Instrument Name (Symbol), Sector Group, Lot Size (Contract Size), Last Trade Price (LTP), Price Change from previous close, Price Change % from previous close, Open Interest (OI), OI Change from previous close, OI Change % from previous close, Volume (Vol), Average Trade Price (ATP) (similar to VWAP, but considers current day’s price & volume), Day Open (DO), Day High (DH), Day Low (DL), O=H or O=L (Open = Day High or Day Low), OI High (Open Interest Day High), OI Low (Open Interest Day Low), Build Up (Interpretation of Price vs Open Interest Behavior).
You will be able to use any of the predefined filters to filter/sort the stocks such as
Price Gainers,
Price Losers,
OI Gainers,
OI Losers,
Build up Cases like
Long Buildup (Price Up, OI Up),
Short Buildup (Price Down, OI Up),
Long Unwinding (Price Down, OI Down),
Short Covering (Price Up, OI Down),
Open = Day High,
Open = Day Low
Active Contracts by Open Interest,
Active Contracts by Volume.
You will also be able to remove the predefined filters (just click on the button to select/deselect the filters) and apply your own filters (custom filters),
For example, Price Up Greater Than 3% AND Open Interest Up Greater than 5%, and voila, you will get the result like the one below:
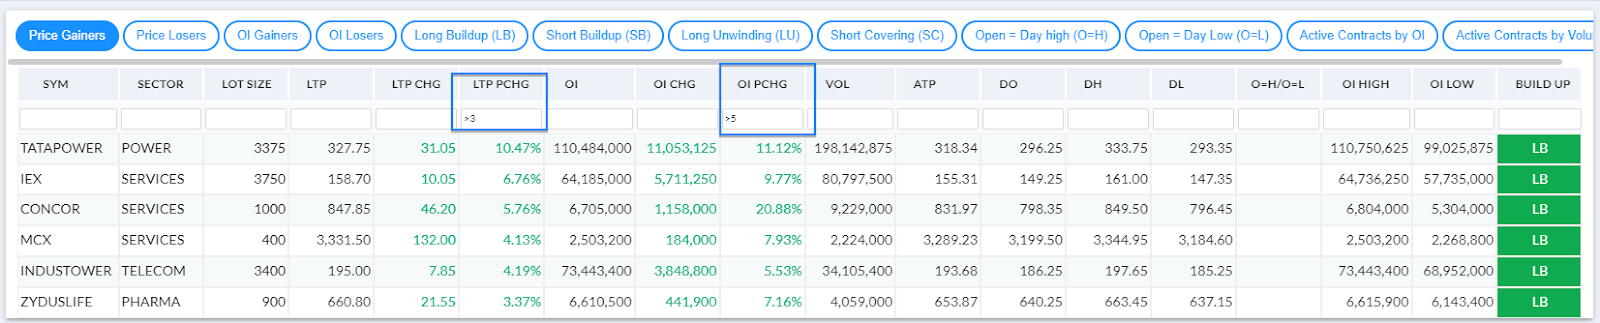
With these options, you can find the stocks as per your criteria and trade them.
In the next post, we will explain about how you can easily switch between Futures and Spot charts of all the trading instruments in Futures & Spot Charts.