

FNOTrader - Futures & Spot Charts
Switch between Spot and Futures (current month) chart seamlessly by a click of a button and find your trade.

Charts powered by Trading view Lightweight charts, it’s super fast and super responsive to display charts.
You will be able to switch between Spot and Futures (current month) chart seamlessly by a click of a button.
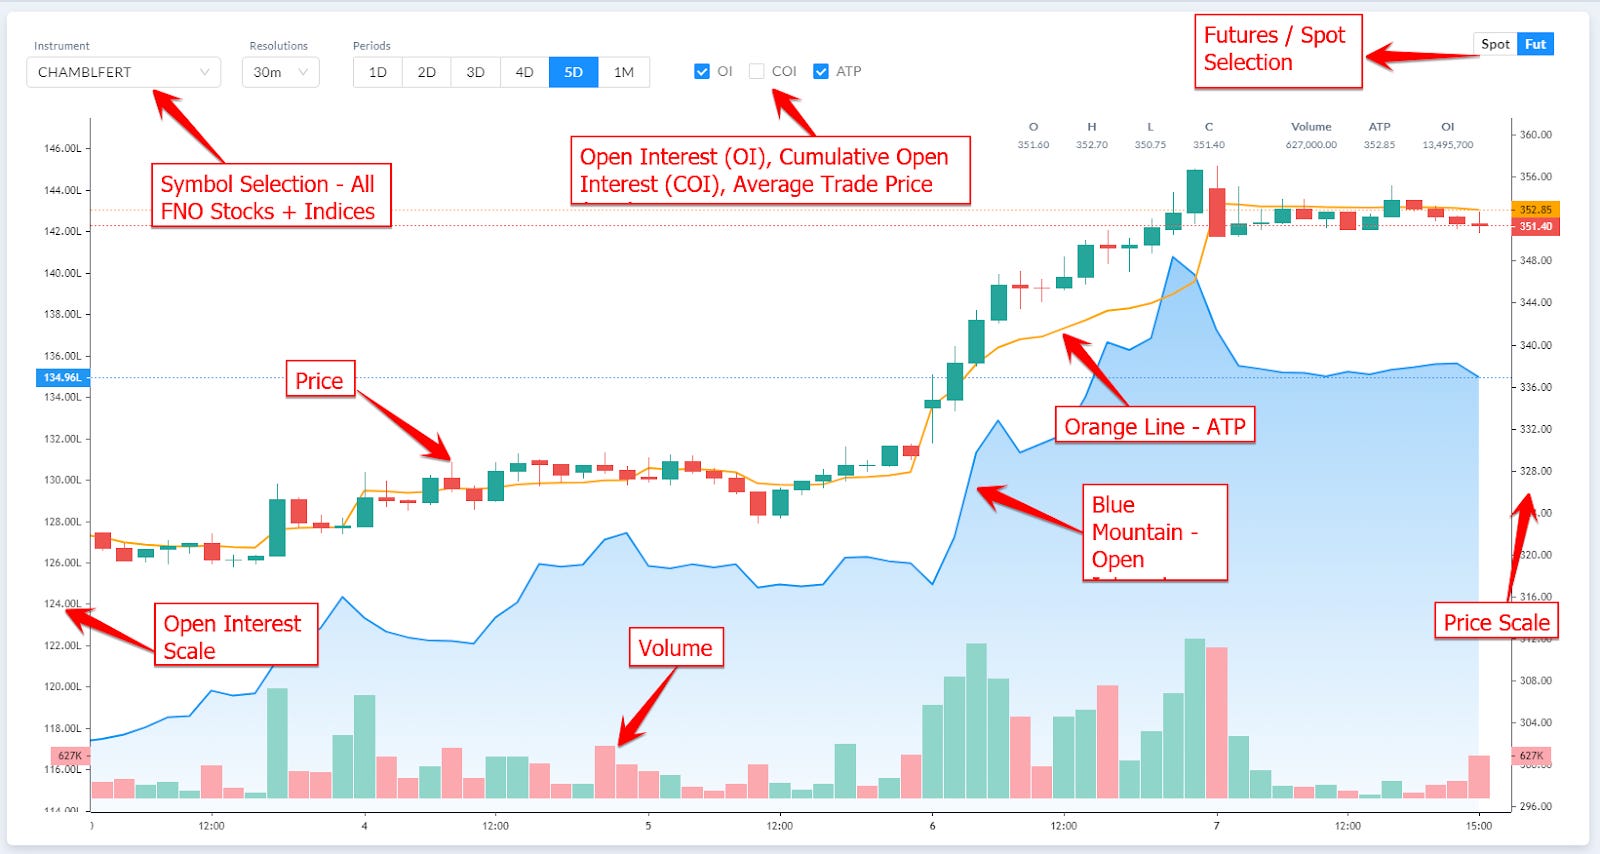
You will be able to see a Price chart in candlestick chart format, Average Trade price (ATP), Volume, Open Interest (OI) and Cumulative Open Interest (COI).
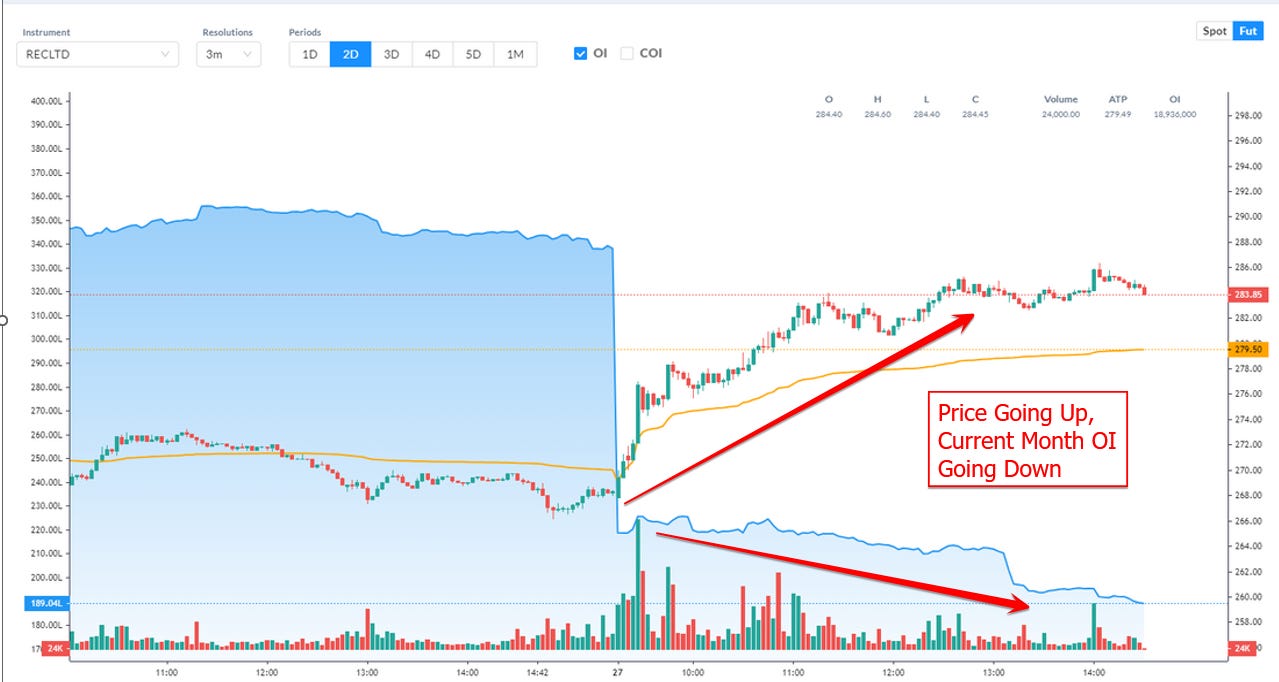
It’s important to highlight the use of Cumulative Open Interest (COI) in analysing Futures Chart. During the last few days of the month, trader’s will start rolling over the contracts (close the current month futures and open the next month futures), in this case, if we only observe the current month futures chart, you will think that the OI is coming down, while in fact, the OI could be going up, and you will be able to analyse properly when you consider COI in your analysis.
At FNOTrader.com, we will display the COI real time by adding the OI of all 3 futures (current/next/far month futures).
REC Futures Chart with current month OI
Same REC Futures Chart with Cumulative Open Interest (COI)
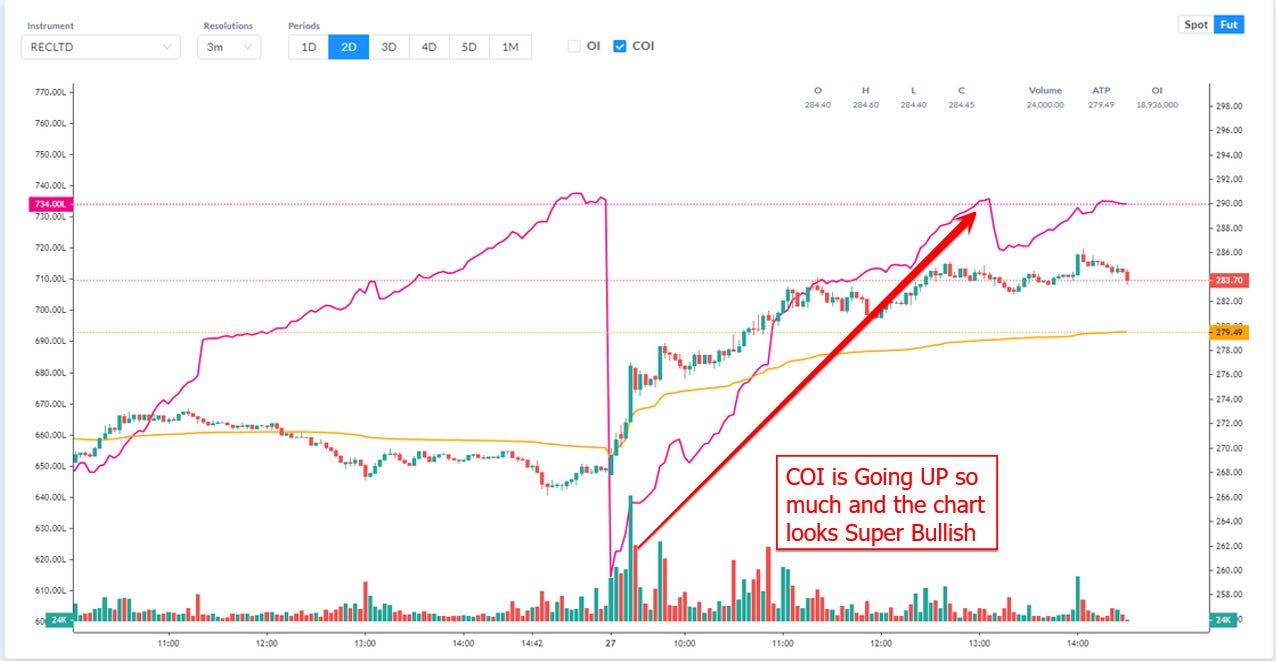
On the left side, Current Month OI is reducing, making you think, there is a short covering happening. Actually, there is a rollover happening next month and the chart is very bullish. You will not find out, unless you also check the next month's futures (right side). Using FNOTrader.com, you will see the COI (cumulative OI) tracked real time.
In the next post, we will explore how you can track the Top 10 Heavy weight stocks for each of the Indices.